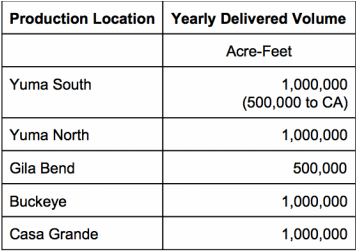
What is the Water Demand for Arizona?
What will it Cost?
- Comparison of the costs of different production types (R/O vs Distillation)
- Comparison of the energy requirements of different production types
- Comparison of the costs of generating energy from fossil fuels, solar, or wind power
- Determine the cost of the conveyance system (pipelines, pumping stations, recharge facilities)
- Comparison of the size and cost of brine waste evaporation ponds vs direct discharge into the ocean
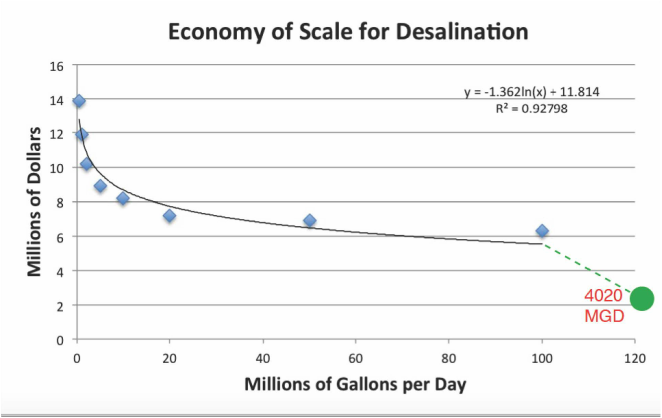
The cost of energy for this scale of project is staggering. In the middle east, where large scale desalination is common, fossil fuels are relied on for production. Based on the availability and low cost of fossil fuel energy production, many countries such as Saudi Arabia do not have a problem meeting energy needs for large scale desalination processes. The goal of our project was for long term, sustainable clean water production, preferably not at the expense of adding large amounts of C02 into the atmosphere. This requirement limited us to wind or solar energy production. Wind has the lowest production costs, while thermal solar had the highest, but again, production costs are just one piece of the puzzle. The land required for both wind and solar generation on a project of this size is unmanageable. By dividing up the desalination plants, this divides up the land requirements from one large field to 5 smaller fields. This also opens up the option to have solar panels follow the pipeline, heating up the water along the way, until it reaches the distillation plant. Heating up the water to near distillation temperatures will also reduce the size of the energy field at each plant location.
The handling of the sheer volume of waste that would be generated from a system of this size was a significant issue. The volume of brine that would be directly pumped back into the ocean was calculated to be 1.8 MA/y. If a football field is nearly one and a half acres, that translates to 1.4 million football fields at 1 foot deep of super-high salinity waste back into the Gulf of California. The ecological impact of this disposal method was one that has never been attempted, and there is no study that would give us comparable data as to the impacts on such a sensitive environment as the Gulf of California. That being said, the other disposal option is to build evaporation ponds next to the plant. Evaporation ponds allow for a completely dry waste that can be harvested and sold to interested parties. With a R/O system located at the coast, the evaporation ponds will again have to be large enough to handle 5000 football fields at 1 foot deep every single day.
In the last ten years the need for affordable desalination technology has increased significantly in Arizona and around the world due to a growing demand for freshwater. This need is directly linked to population growth, urbanization and population density which have led to a significant rise in water consumption per day. Much of this water is designated for farming, industrial or domestic use. Today, water desalination as a method of freshwater production has become a realistic option because the costs associated with the operation have decreased significantly in recent years due to the advancement of more sustainable technologies [3]. There are several factors that contribute to the full cost per cubed meter of desalinated water produced. These include plant capacity, site-specific charges, the overall capital costs of the project, the operating costs of the plant, the cost of transporting the desalinated water, as well as various subsidies and local considerations. These costs will vary by region which is what causes the flux in overall cost of a particular method like multi-effect distillation and reverse osmosis [7].
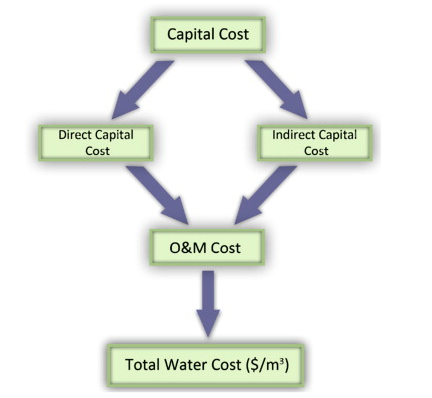
What does the capital cost include?
The capital cost includes all direct and indirect costs associated with the production of a desalination system from the beginning planning stages to the building of the plant and the production of water. These include developing designs and blueprints, securing reliable funding for the plant, the purchasing cost of required equipment, the cost of auxiliary equipment, all land and installation/construction interest and charges, water intake, and brine discharge. [3]
What does the operating cost include?
Expenses including any amortization, insurance or fixed charges, pre and post treatment costs, labor and maintenance, water storage, required energy, required chemicals, pump replacement, membrane replacement (for reverse osmosis) and brine/waste disposal are associated with the annual operating costs. [3]
What is the total water cost (TWC)?
This is also referred to as the life cycle cost of a desalination system and can be viewed as the sum of the capital cost and the operating cost, divided by the volume of the annual potable water production of the plant. It is important to note that the total water cost does not include distribution costs which are a separate expense. [3]
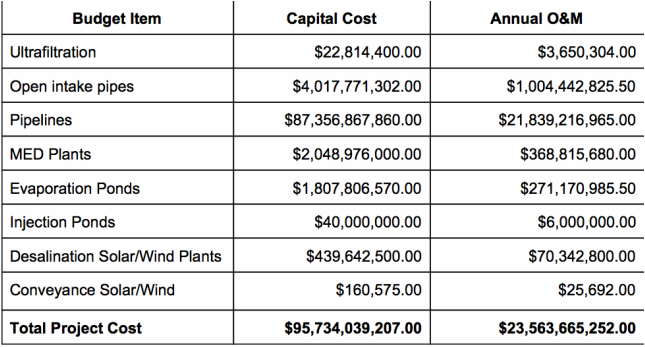
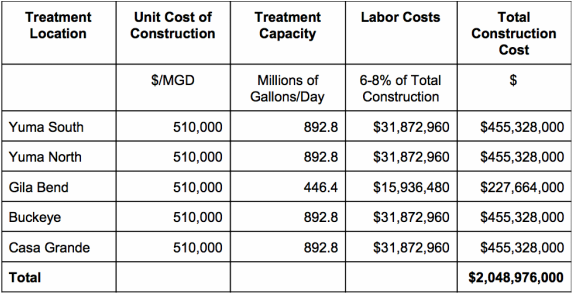
What is the Cost of the Plant Construction?
What is the Cost of Operation and Management?
The fixed costs include amortization and insurance for the finalized site location. Amortization is basically the repayment of past incurred debt on a fixed schedule. This would usually be set up in an initial contract between the investors and the owners of the site. This is a projected action that is based on revenue created from the project and can be spread out according to the agreement and terms of investment. The insurance is necessary for operation under federal regulation and is to protect the plant of major damages as well as any legal issues that may involve the site of the project or its workers. This is usually a seen from a protection perspective of the property and its structures and equipment. [15]
The variable costs involved in operation and management can make or break a projects success in some cases because it is sometimes unpredictable and an unplanned situation. The major variable costs includes energy, labor, chemicals, and maintenance. Labor costs can be site-specific and also depend on plant ownership being public or private or the possibility of a special arrangements such as outsourcing of plant operation. The type of skills that are needed for the operation of the plant as well as the workers needed to maintain and maintenance the plant will be adjustable based on the site and its technology and equipment. The inconsistency of the energy cost comes from the diverse cost of the type of energy and its availability of a power source. [15]
The chemical use is very reliant on on the initial water quality and composition. This includes the need for higher or lower chemical concentrations for pre and post treatment options. Maintenance is something that will always be needed in any type of project involving equipment. Equipment breaks, malfunctions or is in need of an update or replacement this is usually scheduled to insure unexpected failures and can be outsourced as well. [15]
What is the Energy Consumption for Water Conveyance?
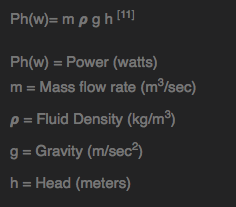
The amount of energy required to pump the water from the ultrafiltration facility in Sonora, to the five selected locations throughout Arizona was calculated by using thermo-fluid engineering formulas. By finding the necessary mass flow rate for each segment of the pipe, as well as calculating the amount of head in each segment, we were able to use a formula to equate necessary pump power. Additionally it was important to factor in the density of seawater (~1.025g/cm3) as well as the force that gravity exerts on the moving water (9.81m/sec2) in order to create an accurate estimation for conveyance energy consumption.
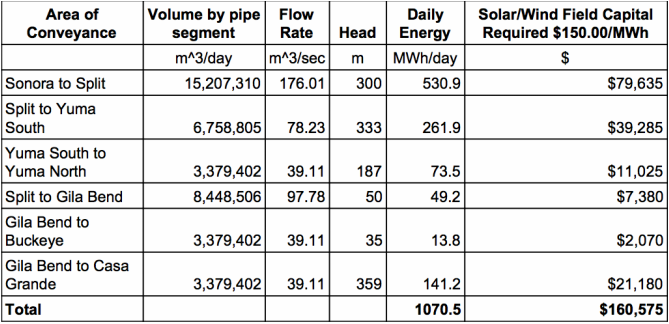
A breakdown for the various components of the conveyance system has been created in order to show the energy consumption of pumping filtered seawater from the intake pipes in Mexico, to the various final destinations throughout Arizona. This will also provide a clear idea of the scale of the pipeline project that we are building to meet our goal of delivering just over 15 million cubic meters of freshwater per day.
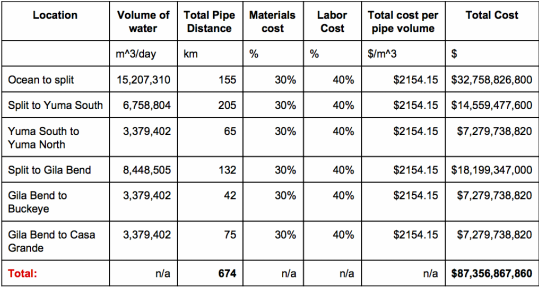
What is the Cost of the Pipelines?
References
[2]2015, California State Water Project Overview, California Department of Water Resources.
[3] Ghaffour, N., Missimer, T. and Amy, G. (2013). Technical review and evaluation of the economics of water desalination: Current and future challenges for better water supply sustainability. Desalination, 309, pp.197-207.
[4] Isokait, W. A. (1998). Project labor agreements: An industry perspective. Journal of Labor Research, 19(1), 65-71. Retrieved from http://login.ezproxy1.lib.asu.edu/login?url=http://search.proquest.com/docview/214005009?accountid=4485
[5]Kaminski D & Jensen M. 2005, Introduction to Thermal and Fluids Engineering, John Wiley & Sons Inc. pp. 428-429.
[6]Pitzer, G & Eden, S & Gelt, J 2007 ‘Layperson’s Guide to Arizona Water’ Water Education Foundation and University of Arizona Water Resources Research Center
[7] Reddy, K. and Ghaffour, N. (2007). Overview of the cost of desalinated water and costing methodologies. Desalination, 205(1-3), pp.340-353.
[8]Rohde M 2014, Recharge: Groundwater’s Second Act, Water in the West: Stanford.
[9]Rui, Z & Metz, P & Reynolds, D & Chen, G & Zhou, X 2011, Historical Pipeline Construction Cost Analysis, International Journal of Oil Gas and Coal Technology, Vol. 4, No. 3, pp. 254.
[10] 2011, Seawater Desalination Costs, Water Reuse Association Desalination Committee, pp. 6.
[11] 2011, Seawater Desalination Costs, Water Reuse Association Desalination Committee, pp. 4.
[12] 2011, Seawater Desalination Costs, Water Reuse Association Desalination Committee, pp. 9.
[13]2005 ‘Securing Arizona’s Water Future’ Arizona Department of Water Resources
[14]Van der Bruggen,B, 2002, ‘Distillation vs. membrane filtration: overview of process evolutions in seawater desalination’ Desalination, No. 143 Issue 3, pp. 207-218
[15] Younos, T. (2005). The Economics of Desalination. JOURNAL OF CONTEMPORARY WATER RESEARCH & EDUCATION, [online] 132(1), pp.39-45. Available at: http://onlinelibrary.wiley.com/doi/10.1111/j.1936-704X.2005.mp132001006.x/pdf [Accessed 15 Mar. 2015].
[16]Zhang, HL & Baeyens, J & Degreve, J & Caceres, G 2013, ‘Concentrated Solar Power plants: Review and Design Methodology’ Renewable and Sustainable Energy Reviews, No. 22, pp. 466-481
